Profile Java Connector Memory Usage
This tutorial demos how to profile the memory usage of a Java connector with Visual VM. Such profiling can be useful when we want to debug memory leaks, or optimize the connector's memory footprint.
The example focuses on docker deployment, because it is more straightforward. It is also possible to apply the same procedure to Kubernetes deployments.
Prerequisite
Step-by-Step
Enable JMX in
airbyte-integrations/connectors/<connector-name>/build.gradle, and expose it on port 6000. The port is chosen arbitrary, and can be port number that's available.<connector-name>examples:source-mysql,source-github,destination-snowflake.application {
mainClass = 'io.airbyte.integrations.<connector-main-class>'
applicationDefaultJvmArgs = [
'-XX:+ExitOnOutOfMemoryError',
'-XX:MaxRAMPercentage=75.0',
// add the following JVM arguments to enable JMX:
'-XX:NativeMemoryTracking=detail',
'-XX:+UsePerfData',
'-Djava.rmi.server.hostname=localhost',
'-Dcom.sun.management.jmxremote=true',
'-Dcom.sun.management.jmxremote.port=6000',
"-Dcom.sun.management.jmxremote.rmi.port=6000",
'-Dcom.sun.management.jmxremote.local.only=false',
'-Dcom.sun.management.jmxremote.authenticate=false',
'-Dcom.sun.management.jmxremote.ssl=false',
// optionally, add a max heap size to limit the memory usage
'-Xmx2000m',
]
}
Modify
airbyte-integrations/connectors/<connector-name>/Dockerfileto expose the JMX port.// optionally install procps to enable the ps command in the connector container
RUN apt-get update && apt-get install -y procps && rm -rf /var/lib/apt/lists/*
// expose the same JMX port specified in the previous step
EXPOSE 6000Expose the same port in
airbyte-workers/src/main/java/io/airbyte/workers/process/DockerProcessFactory.java.// map local 6000 to the JMX port from the container
if (imageName.startsWith("airbyte/<connector-name>")) {
LOGGER.info("Exposing image {} port 6000", imageName);
cmd.add("-p");
cmd.add("6000:6000");
}Disable the
hostnetwork mode by removing the following code block in the same file. This is necessary because under thehostnetwork mode, published ports are discarded.if (networkName != null) {
cmd.add("--network");
cmd.add(networkName);
}(This commit can be used as a reference. It reverts them. So just do the opposite.)
Build and launch Airbyte locally. It is necessary to build it because we have modified the
DockerProcessFactory.java.SUB_BUILD=PLATFORM ./gradlew build -x test
VERSION=dev docker compose upBuild the connector to be profiled locally. It will create a
devversion local image:airbyte/<connector-name>:dev../gradlew :airbyte-integrations:connectors:<connector-name>:airbyteDockerConnect to the launched local Airbyte server at
localhost:8000, go to theSettingspage, and change the version of the connector to be profiled todevwhich was just built in the previous step.Create a connection using the connector to be profiled.
- The
Replication frequencyof this connector should bemanualso that we can control when it starts. - We can use the e2e test connectors as either the source or destination for convenience.
- The e2e test connectors are usually very reliable, and requires little configuration.
- For example, if we are profiling a source connector, create an e2e test destination at the other end of the connection.
- The
Profile the connector in question.
- Launch a data sync run.
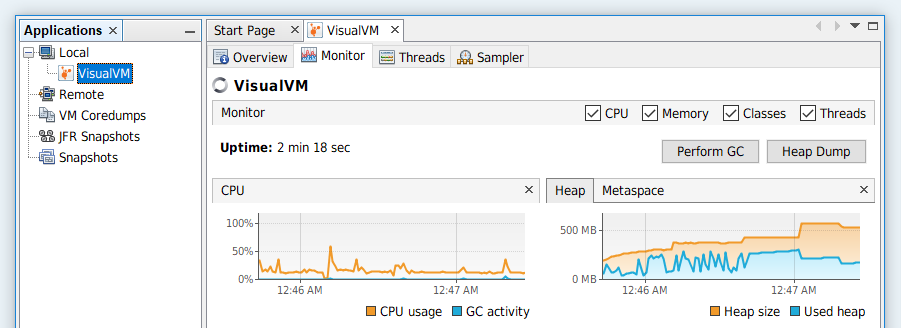
- After the run starts, open Visual VM, and click
File/Add JMX Connection.... A modal will show up. Type inlocalhost:6000, and clickOK. - Now we can see a new connection shows up under the
Localcategory on the left, and the information about the connector's JVM gets retrieved.